Almost all our work involves analysis of geoscience data; sometimes for academic partners and research projects, most often to help commercial clients working in environmental companies, extractive industries, sub-surface waste disposal, the energy sector, and local and national government.
Sometimes the data we analyse are acquired by us – we are pioneers in methods of detailed outcrop characterisation, and ground motion monitoring – other times the data are provided by our clients, or by third parties such as NASA, ESA, and other government agencies. The focus of some projects is on surficial Earth processes; other projects combine data from surface and sub-surface to inform about resources that are currently buried at depth. We have a very broad portfolio – we are data scientists with a wide remit.
Rock-Mass Analysis
Whether it’s stockpile calculations, site or mine planning, slope stability studies, or discontinuity analysis and rock-mass characterisation, we have a wide range of geospatial technologies and expertise to meet your geotechnical requirements.
Example Project: Rock-Mass Analysis
Client:
International Mining Company
The Setting:
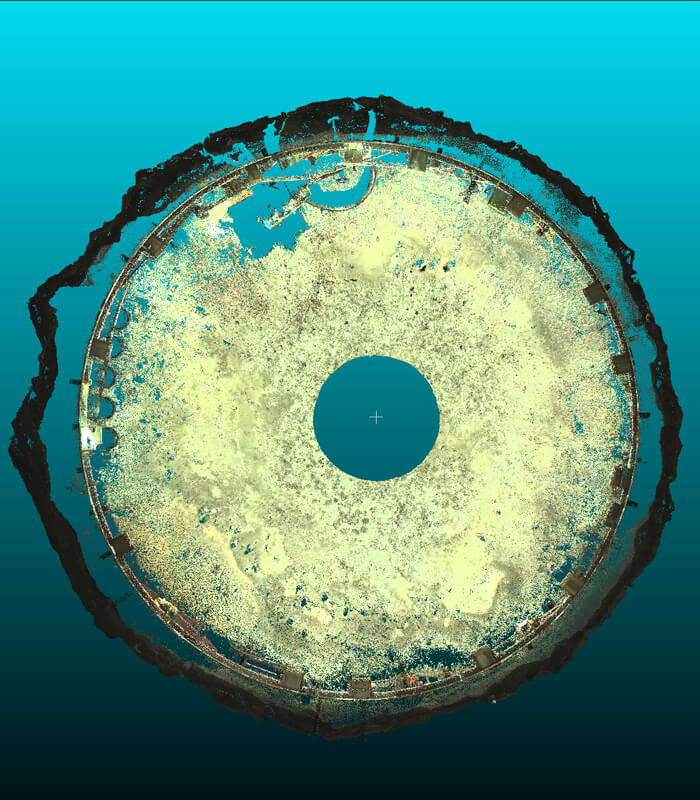
Geotechnical analysis required during excavation of a new shaft.
The Value:
Quantitative measure of overbreak, and input for design of temporary support, grout design and groundwater management. Discontinuity analysis with quantitative rock-mass parameters. Permanent record of rock-face geometry in shaft.
Techologies:
Lidar, discontinuity analysis, rock-mass characterisation.
Reference:

Fracture Network Characterisation
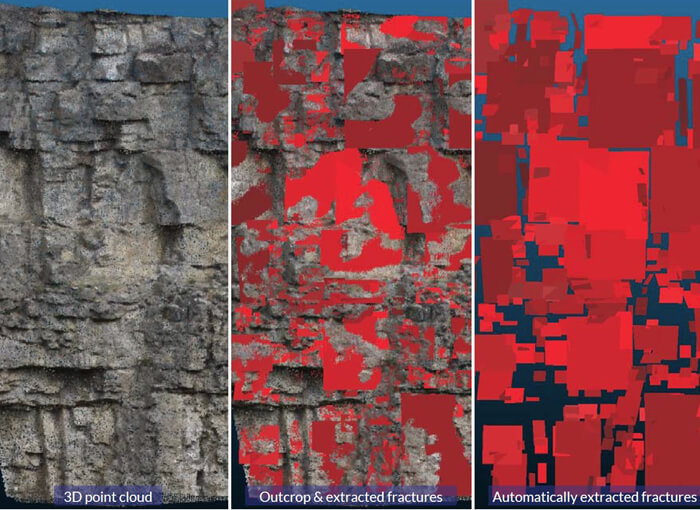
We have many years of hands-on experience in analysing fractured rock, including measurement of discontinuity parameters for geotechnical applications (see above), and to provide more robust inputs for fracture models, including discrete fracture network (DFN) modelling for our oil and gas clients. These methods also have wider relevance in geothermal and hydrogeological applications.
Example Project: Fracture Network Characterisation
Client:
Open-cast Mining Company
The Setting:
Company with active aggregate quarry wanting to improve predictions of block size, yield, and rock face stability.
The Value:
Quantitative discontinuity parameters including set orientation statistics, discontinuity size and spacing distributions, discontinuity clustering, connectivity and RFQ, and more.
Techologies:
Lidar, discontinuity analysis, rock-mass characterisation, fracture network modelling.
Reference:

Lidar, Photogrammetry & 3D Imaging
While we’ve pioneered the use of lidar and digital photogrammetry to capture quantitative outcrop geology for nearly two decades (see references here), we have also routinely used the same geospatial technologies to a wider range of applications, including flood modelling, tree canopy analysis, historical architecture, and even recording an abandoned upland farmhouse before it was moved brick-by-brick to its new home at Beamish Museum.
Example Project: Flood Modelling
Client:
Environmental Consultancy
The Setting:
To carry out necessary flood remediation in an upland village in northern UK, a much more detailed topographic model of the fold plain was required
The Value:
Much more than a standard DEM, we provided a highly detailed 3D model that captured small-scale topography (even in wooded areas), stream bed morphology, vegetation cover, and the height and continuity of low dry stone walls (that can help to slow flood water) but which have hedgerow above them and can’t be seen in aerial imagery.
Techologies:
Lidar, spatial analysis.
Reference:

Repeat Lidar, Change Detection & Monitoring
The high spatial precision of lidar makes it ideally suited for repeat scanning to detect changes in the scanned surface over time. In addition to monitoring of coastal erosion, we’ve used this approach to quantify rates of upland peat degradationCarbon Cycle Research, to give independent verification of the magnitude of ground motion related to an underground gas storage facility detected by our GNSS units, and even to scan before and after flume tank lab experiments to quantify changes in channel beds during outburst floods.
Example Project: Repeat Lidar to Reveal 3D Fault Zone Geometry
Client:
Industrial Consortium
The Setting:
While many of our monitoring projects are designed to quantify rates of natural processes (and/or to pin-point spatio-temporal variability), this project took advantage of the planned progressive removal of the quarry face in an open-cast mine to allow us to build-up a very detailed picture of 3D fault zone architecture.
The Value:
3D fault models with centimetre-scale resolution of a seismic-scale fault
Techologies:
Repeat Lidar, spatial analysis, 3D modelling.
Reference:

GNSS & Ground Motion Monitoring
The Global Navigation Satellite System (GNSS) consists of groups of satellites that provide positioning and timing data, and include GPS, Galileo, GLONASS, BeiDou, and other constellations. Since 2016 we have pioneered the development and deployment of low-cost GNSS units for long-term, remote monitoring of ground motion. Following early success in monitoring tectonic displacements on emergent faults in Italy and New Zealand, we have since expanded use to include monitoring of subsidence, erosion and slope instability, volcanic hazard, geothermal energy production plants ], underground gas storage, and a range of other geoscience and engineering purposes.
Example Project: GNSS Monitoring
Client:
European Space Agency (ESA)
The Setting:
Proof-of-concept demonstration of use of GNSS for monitoring of coastal cliff instability
The Value:
New data from the coast near Whitby (NE England) showing a number of discrete small slip events, and the temporal correlation with elevated rainfall.
Techologies:
Low cost GNSS, GSM, time series analysis, spatial statistics.
Reference:

Earth Observation & GIS
Since much of the data that we analyse has a spatial component, GIS is core technology that we use every day, in more-or-less every project that we do. Our main tools are ArcGIS, QGIS, GRASS, ER Mapper, FME, and a whole range of customised scripts and code snippets that we write as needed.
Our use of Earth Observation data spans a wide range of imagery for projects that range from multi-scale fracture network analysis, remote geological mapping from multi-spectral imagery, remote interpretation of structure and tectonics, ground motion monitoring (InSAR), and as a basis for spatial proximity analysis.
Example Project: Earth Observation
Client:
International Energy Company
The Setting:
Structurally complex onshore region in Asia, characterised by sparse outcrops of coarse clastics (sandstones), separated by poorly exposed mudstone and shales.
The Value:
Greatly improved geological mapping in which subtle long-wavelength unconformities can be delineated across areas of poor exposure.
Techologies:
Greatly improved geological mapping in which subtle long-wavelength unconformities can be delineated across areas of poor exposure.
Reference:

Example Project: GIS
Client:
GeoEnergy Durham and Environment Agency
The Setting:
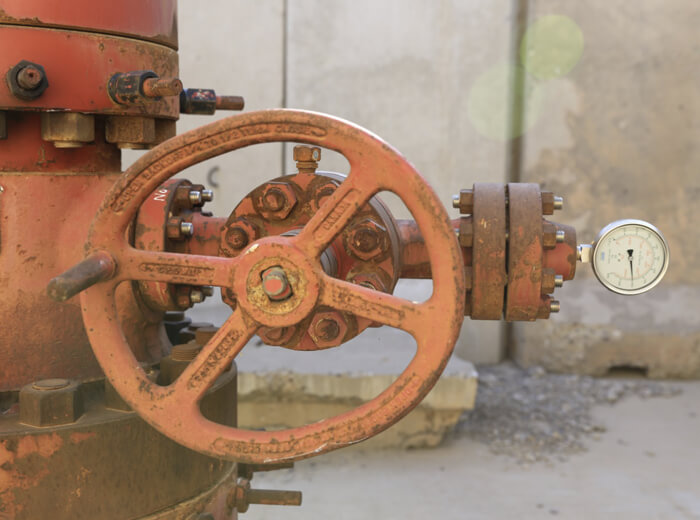
Over two thousand wells have been drilled onshore in the UK for the exploration and production of hydrocarbons. Work is needed to evaluate potential risks to the environment that might arise from re-purposing existing wells.
The Value:
Consultation report on the risks associated with the re-purposing of former oil and gas wells for uses that can aid UK’s transition to carbon neutrality.
Techologies:
GIS and spatial analysis.
Reference:

Contact GRL Now:
+44 (0)191 384 1759


